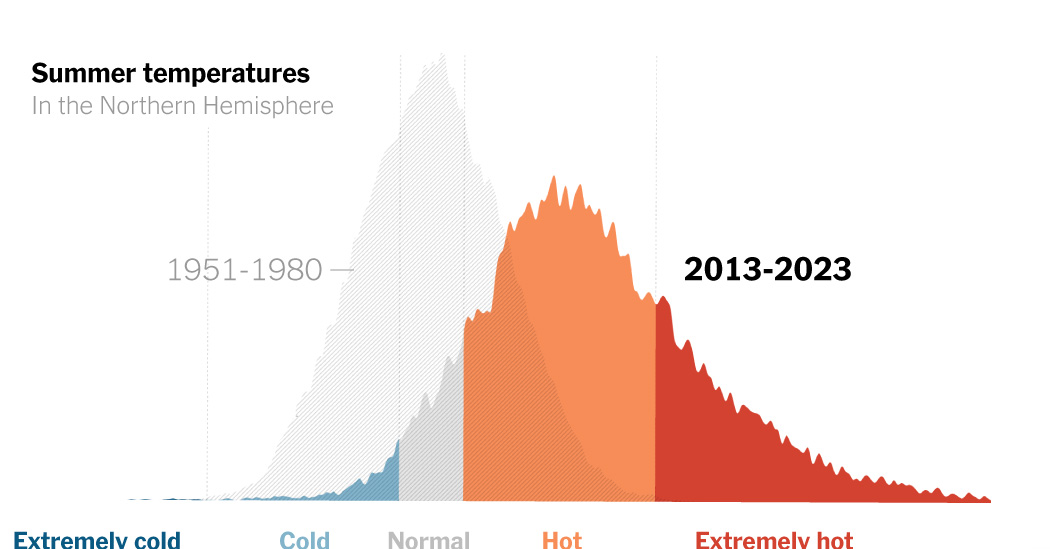
That is a bizarre and confusing graph
A normal distribution graph is confusing?
Extremely vague units on both axes, throwing in the years on top makes horizontal also look like a timeline but its not.
This graph is terrible, since it gives no scale. A person with no knowledge beforehand wouldn’t know if that’s a 0.1 degree shift or a 20 degree shift.
No fucking shit. How many articles do we need saying this same damn thing?
Only when people paying attention to an issue are completely sick of seeing the same message again and again does it start to sink in with the general public. So a lot.
This is one hill we’ll have to drag the deniers over kicking and screaming. I doubt they will ever come around, even as the weather gets to the point of melting their face.
This, exactly.
We are never going to convince them. We have to figure out a way to move forward without their support.
People don’t give a shit and they’re never going to until it’s far too late to do anything about it. Hell, we’re probably already there and still no one who matters gives a shit.
More
This graph makes me sad.
Plenty of jobs available in the renewables sector, or the agtech sector, or clean transport
Doing something that helps, and getting paid for it, eases the existential dread :)
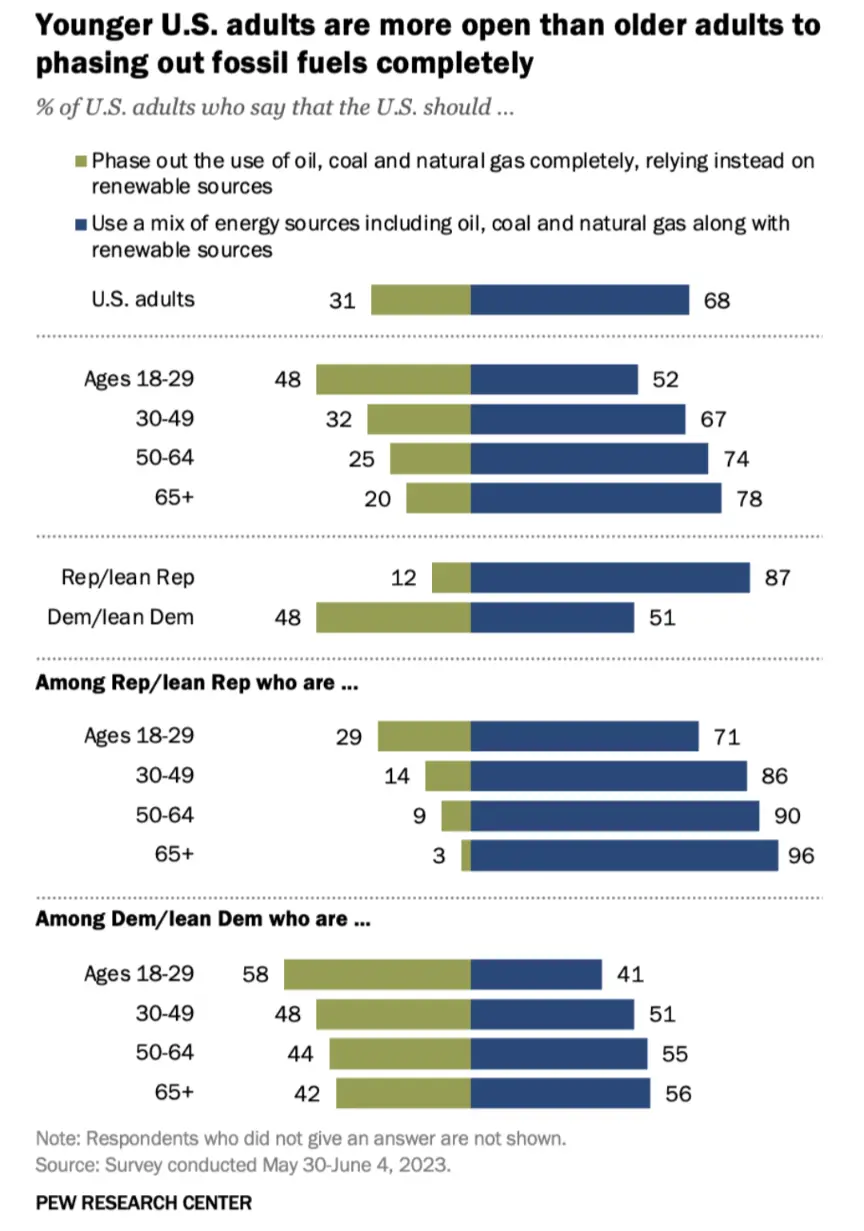
dems not even really behind this 😐
Around here, it hasn’t gotten above 100 in many years, so people like to point at that to say nothing has changed.
Never mind the fact that spring is starting earlier and earlier, dropping shitloads more rain than normal, and it’s October and people still have A/C on…
I still need to mow, in northern ND in October. I swam outside in a pool last week. This is crazy.
I actually just mowed three days ago, and while the nights have made pools too cold, it’s certainly still warm enough during the day.
Yesterday was the coldest it’s been mid-day since spring, and it took two days of rain and cold fronts to get there.
Summer? It’s autumn, 20°C, and native wildflowers are flowering again.
what’s up with that graph? like just have temperature on the Y axis and time on the X axis it’s not that hard
They’re trying to show a change in probability distribution, not just a temperature change over time. I agree that scale and such would be helpful.
I don’t need to look at a graphs, I can just go outside or read the daily news of “new record heat temperatures!”
Paywall
It’s gift link so you shouldn’t hit the paywall
Removed by mod
im an inside worker and notice. im over 50 though but man the typical for before 1990 compared to the typical after 2000 is so massive. Its like I moved south.