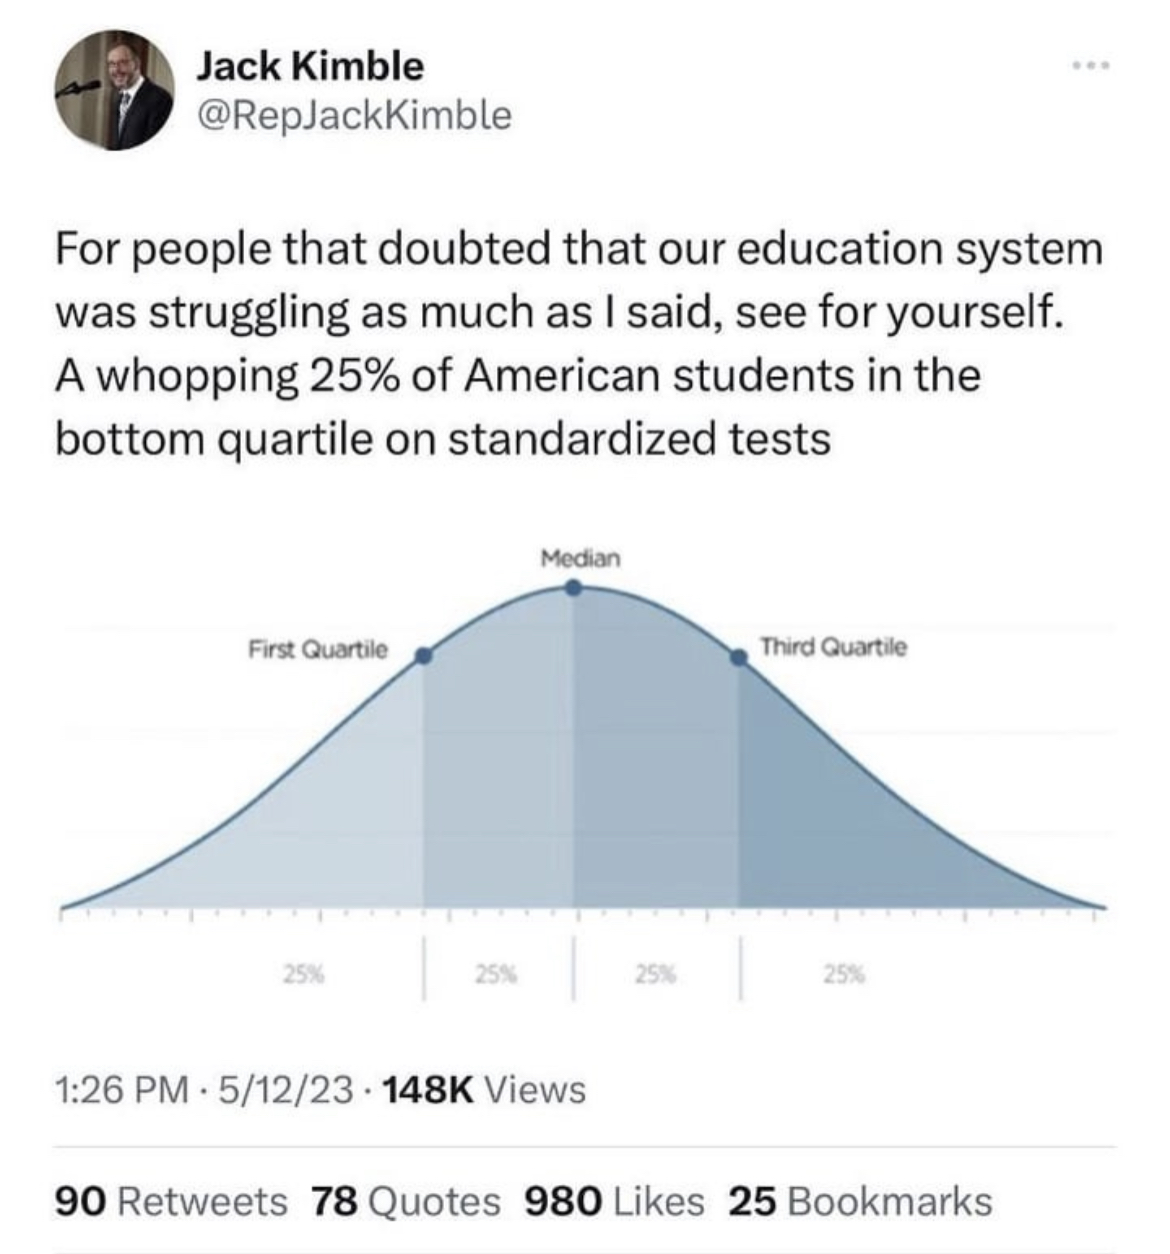
Not if you’re breaking the data into quartiles. Holy shit, do you really think the curve will be any different? Really? All that will happen is that some people will move around in the distribution. And the smoothing does not at all relate to how intelligence is measured but rather how it’s reported - in this graph.


Not if you’re breaking the data into quartiles. Holy shit, do you really think the curve will be any different? Really? All that will happen is that some people will move around in the distribution. And the smoothing does not at all relate to how intelligence is measured but rather how it’s reported - in this graph.
I think you’re talking past each other — you’re talking about the box plot and they’re talking about the histogram